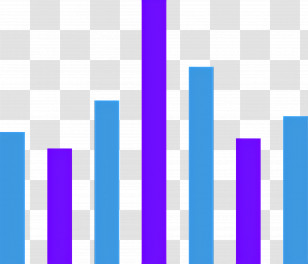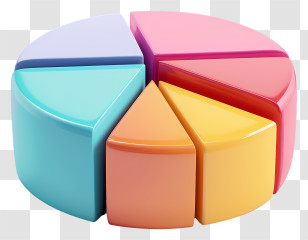
An illustration of a computer screen with a pie chart on it. The pie chart is divided into different sections, each representing a different aspect of data analysis. The chart is colorful and has a circular shape with a blue circle in the center. Below the pie chart, there are several bars of different colors - red, orange, yellow, green, blue, and purple. The bars are arranged in a horizontal line, with the highest bar at the bottom and the lowest at the top. The tabs appear to be related to data analysis, such as graphs and charts.
User antonwne uploaded the image
User antonwne uploaded the image
Infographic - Charts And Data Visualization Illustration PNG
. The resolution of this PNG file is 2048 x 2048 pixels and it has a file size of 867.57 KB.Infographic - Charts And Data Visualization Illustration PNG
You might also like these images below...