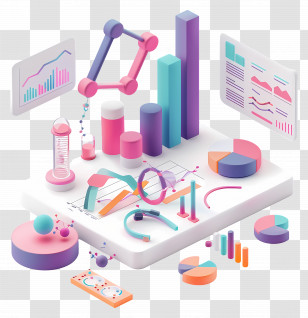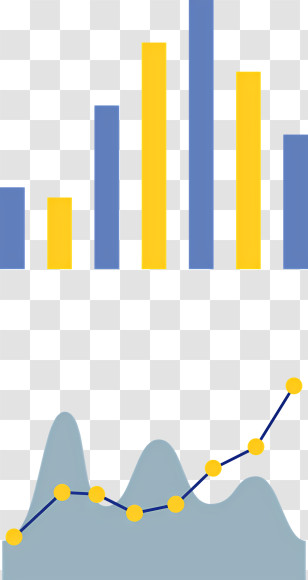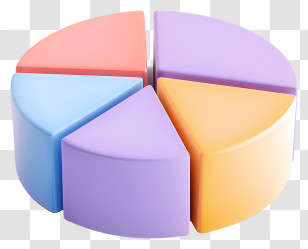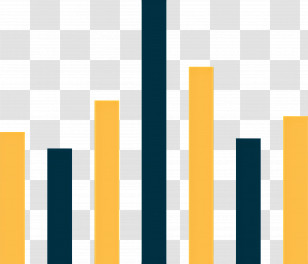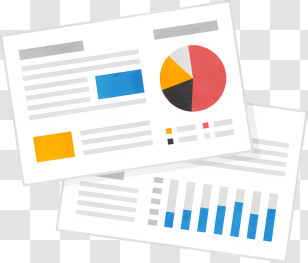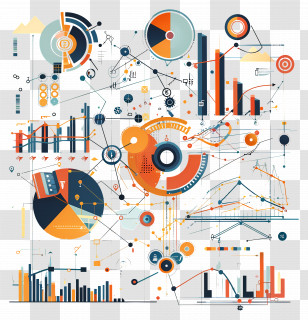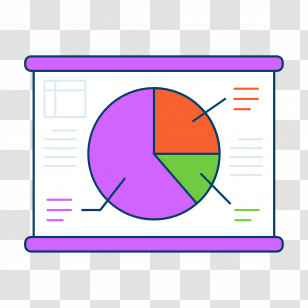
An isometric illustration of various financial data and graphs. It is divided into different sections, each representing a different aspect of the data. The first section on the left shows a bar graph with multiple bars of different colors, representing different data points. The bars are arranged in a horizontal line, with the highest bar at the top and the lowest at the bottom. The graph is colored in shades of blue, orange, and purple, representing growth and progress. The second section in the middle shows a computer monitor with a graph on the screen, representing data analysis or statistics. The third section shows a pie chart, a calculator, and a magnifying glass, representing the data being analyzed or analyzed. The fourth section shows an orange pie chart and a blue pie chart. The fifth section shows two blue and orange graphs, representing graphs and charts. The sixth section shows three orange and blue graphs, one of which shows a graph and the other shows a blue and white graph. The seventh section shows four orange and white graphs, the eighth section shows five orange and gray graphs, and the ninth section shows six orange and yellow graphs.
User judsoni uploaded the image
User judsoni uploaded the image
Statistical Data - Modern Data Visualization Graphics PNG
. The resolution of this PNG file is 4084 x 4148 pixels and it has a file size of 7.54 MB.Statistical Data - Modern Data Visualization Graphics PNG
You might also like these images below...