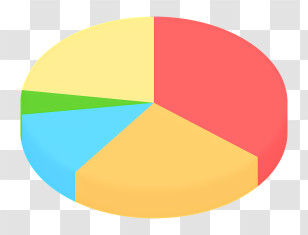
A pie chart, which is a visual representation of a pie graph. The chart is divided into four sections, each representing a different color - green, blue, yellow, and orange. The green section is on the left side of the chart, the blue section is in the middle, and the yellow section is at the bottom. The pie chart is circular in shape and has a black outline around the edges. The colors of the sections are arranged in a way that they are overlapping each other, creating a sense of depth and dimension.
User brocknar uploaded the image
User brocknar uploaded the image
Clip Art Statistics - Pie Chart - Seo Analytics PNG
. The resolution of this PNG file is 512 x 512 pixels and it has a file size of 20.01 KB.You might also like these images below...