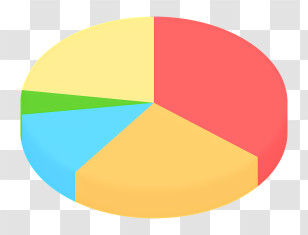
A circular graphic with a yellow background. In the center of the circle, there is a pie chart divided into four sections. The largest section is red, the second largest is orange, the third largest is blue, and the fourth smallest is white. Each section has a percentage symbol on it, indicating that the pie chart is showing a percentage. The pie chart appears to be a visual representation of data or statistics.
User icieolt uploaded the image
User icieolt uploaded the image
Business Report - Area - Analytics PNG
. The resolution of this PNG file is 512 x 512 pixels and it has a file size of 20.88 KB.You might also like these images below...