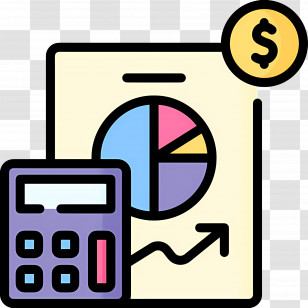
An illustration of a calculator and a document. The calculator is blue in color and has a yellow circle on the right side with a percent sign on it. On the left side of the image, there is a sheet of paper with a bar graph on it, which is colored in red, green, yellow, and orange. The bar graph appears to be a financial report or a financial statement.
User morgantt uploaded the image
User morgantt uploaded the image
Budget Calculation - Calculator With Percentage For Financial Analysis PNG
. The resolution of this PNG file is 2048 x 2048 pixels and it has a file size of 916.06 KB.Budget Calculation - Calculator With Percentage For Financial Analysis PNG
You might also like these images below...