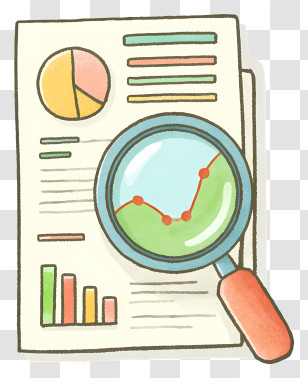
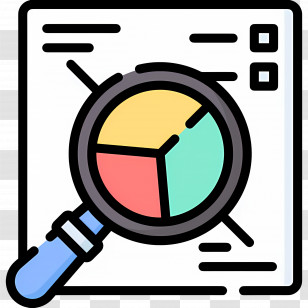
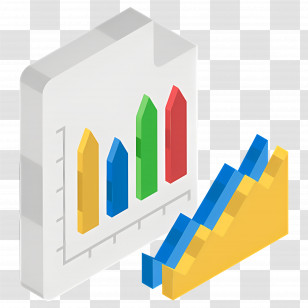
An illustration of a magnifying glass hovering over a bar graph. The bar graph is divided into four sections, each with a different color - red, yellow, and blue. The red section is on the left side of the graph, the yellow section is in the middle, and the blue section is at the bottom. The magnifying lens is magnified, as if it is being used to examine the data.
User alfreduf uploaded the image
User alfreduf uploaded the image
Infographic - Magnifying Glass Over Document Graph For Data Analysis PNG
. The resolution of this PNG file is 2048 x 2048 pixels and it has a file size of 1.08 MB.Infographic - Magnifying Glass Over Document Graph For Data Analysis PNG
You might also like these images below...