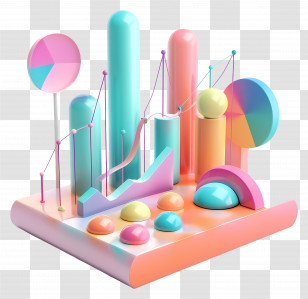
A 3D illustration of a colorful bar graph. The graph is made up of multiple bars of different colors - blue, pink, orange, and yellow. The bars are arranged in a horizontal line, with the blue bars on the left side and the pink bars in the middle. On the right side of the graph, there is a pink and orange wave-like structure, which appears to be a slide or a slide. There are also several spheres and lines connecting the bars, representing the data points.
User thalte uploaded the image
User thalte uploaded the image
Graph - 3D Colorful Business Graph Illustration PNG
. The resolution of this PNG file is 3940 x 4000 pixels and it has a file size of 4.79 MB.You might also like these images below...